Class to plot data as lines, crosses etc, as gnuplot does, duplicates functionality in class GraphPlotter.
More...
#include <Utils/DataPlot.hh>
|
| void | DrawLine_ (unsigned int x, unsigned int y, unsigned int x2, unsigned int y2) |
| |
| int | WindowToViewport_ (float wx, float wy, unsigned int &vx, unsigned int &vy) |
| |
Class to plot data as lines, crosses etc, as gnuplot does, duplicates functionality in class GraphPlotter.
- Author
- evers
- Date
- April 2009
- Examples:
- ExampleDataPlot.cpp.
Definition at line 42 of file DataPlot.hh.
| Enumerator |
|---|
| Points |
|
| Lines |
|
| Cross |
|
Definition at line 47 of file DataPlot.hh.
| DataPlot::DataPlot |
( |
Image< unsigned char > & |
PlotArea | ) |
|
| void DataPlot::CutLinePlot |
( |
| ) |
|
| void DataPlot::DrawLine_ |
( |
unsigned int |
x, |
|
|
unsigned int |
y, |
|
|
unsigned int |
x2, |
|
|
unsigned int |
y2 |
|
) |
| |
|
protected |
| void DataPlot::DrawXAxis |
( |
| ) |
|
| void DataPlot::DrawYAxis |
( |
| ) |
|
| void DataPlot::Plot |
( |
const std::vector< float > & |
data | ) |
|
| void DataPlot::Plot |
( |
const std::vector< float > & |
x, |
|
|
const std::vector< float > & |
y |
|
) |
| |
| int DataPlot::Plot |
( |
float |
x, |
|
|
float |
y |
|
) |
| |
draw single value, no AutoRange possible
- Returns
- 0 for success, -1 for x out of range, -2 for y out of range
Definition at line 144 of file DataPlot.cpp.
| void DataPlot::SetAutoRange |
( |
bool |
x, |
|
|
bool |
y |
|
) |
| |
| void BIAS::DataPlot::SetBGColour |
( |
ColourRGB< unsigned char > |
color | ) |
|
|
inline |
| void BIAS::DataPlot::SetPenColour |
( |
ColourRGB< unsigned char > |
color | ) |
|
|
inline |
| void BIAS::DataPlot::SetThickness |
( |
unsigned int |
t | ) |
|
|
inline |
| void DataPlot::SetXRange |
( |
float |
min, |
|
|
float |
max |
|
) |
| |
| void DataPlot::SetYRange |
( |
float |
min, |
|
|
float |
max |
|
) |
| |
| int DataPlot::WindowToViewport_ |
( |
float |
wx, |
|
|
float |
wy, |
|
|
unsigned int & |
vx, |
|
|
unsigned int & |
vy |
|
) |
| |
|
protected |
| bool BIAS::DataPlot::AutoRangeX_ |
|
protected |
| bool BIAS::DataPlot::AutoRangeY_ |
|
protected |
| ColourRGB<unsigned char > BIAS::DataPlot::BGColour_ |
|
protected |
| unsigned int BIAS::DataPlot::BorderX_ |
|
protected |
| unsigned int BIAS::DataPlot::BorderY_ |
|
protected |
| unsigned char BIAS::DataPlot::ChannelCount_ |
|
protected |
| unsigned char** BIAS::DataPlot::DrawIda_ |
|
protected |
| int BIAS::DataPlot::LastVX_ |
|
protected |
| int BIAS::DataPlot::LastVY_ |
|
protected |
| float BIAS::DataPlot::MaxX_ |
|
protected |
| float BIAS::DataPlot::MaxY_ |
|
protected |
| float BIAS::DataPlot::MinX_ |
|
protected |
| float BIAS::DataPlot::MinY_ |
|
protected |
| ColourRGB<unsigned char > BIAS::DataPlot::PenColour_ |
|
protected |
| Image<unsigned char >* BIAS::DataPlot::PlotArea_ |
|
protected |
| unsigned int BIAS::DataPlot::PlotAreaHeight_ |
|
protected |
| unsigned int BIAS::DataPlot::PlotAreaWidth_ |
|
protected |
| int BIAS::DataPlot::Thickness_ |
|
protected |
The documentation for this class was generated from the following files:
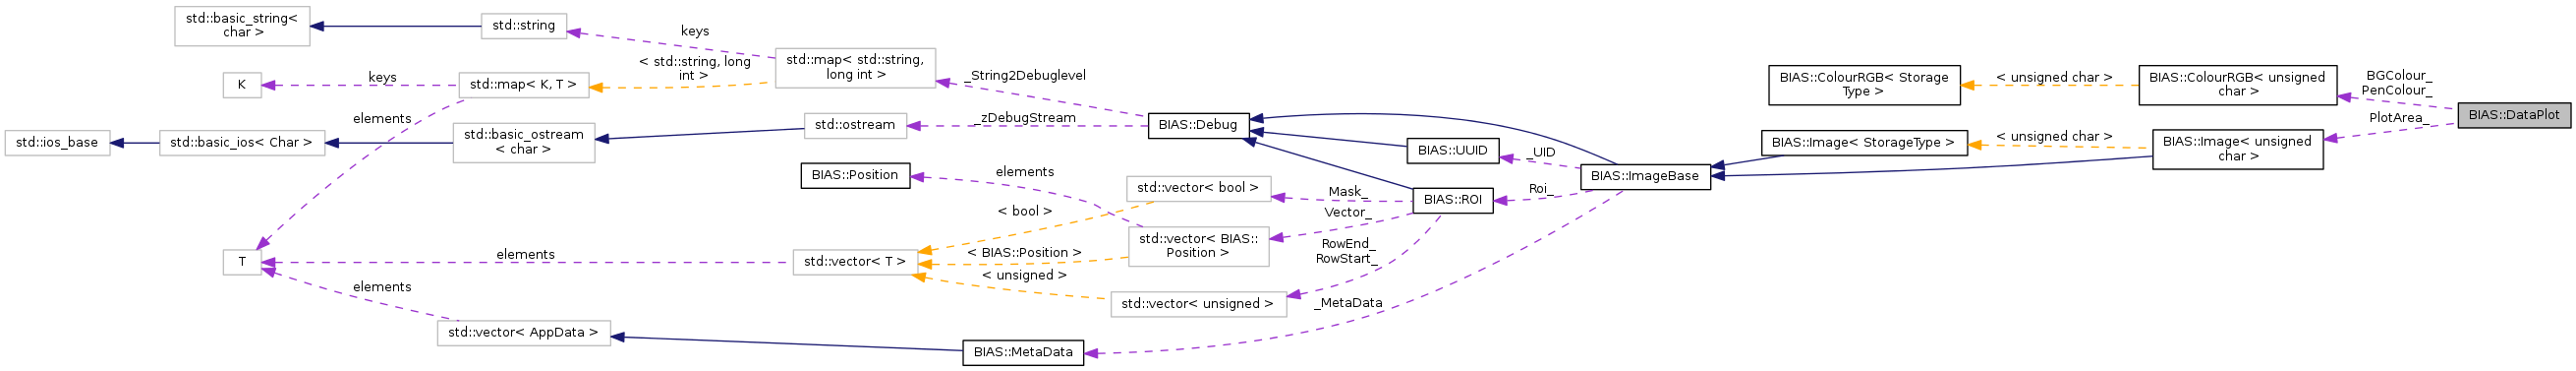
 Collaboration diagram for BIAS::DataPlot:
 1.8.5
1.8.5